📉 Graphing Calculator: Plot Functions Online

Draw graphs of functions and read off roots, turning points and where they cross.

No ratings yet — be the first

Enter details

Log in or create a free account to save your inputs and results, so you don't have to enter them again next time.🔒 No spam, ever. We never sell or share your details, and you can delete your history or account at any time. Privacy policy

Fill in the details and click Calculate to see your results.

Formula at a glance

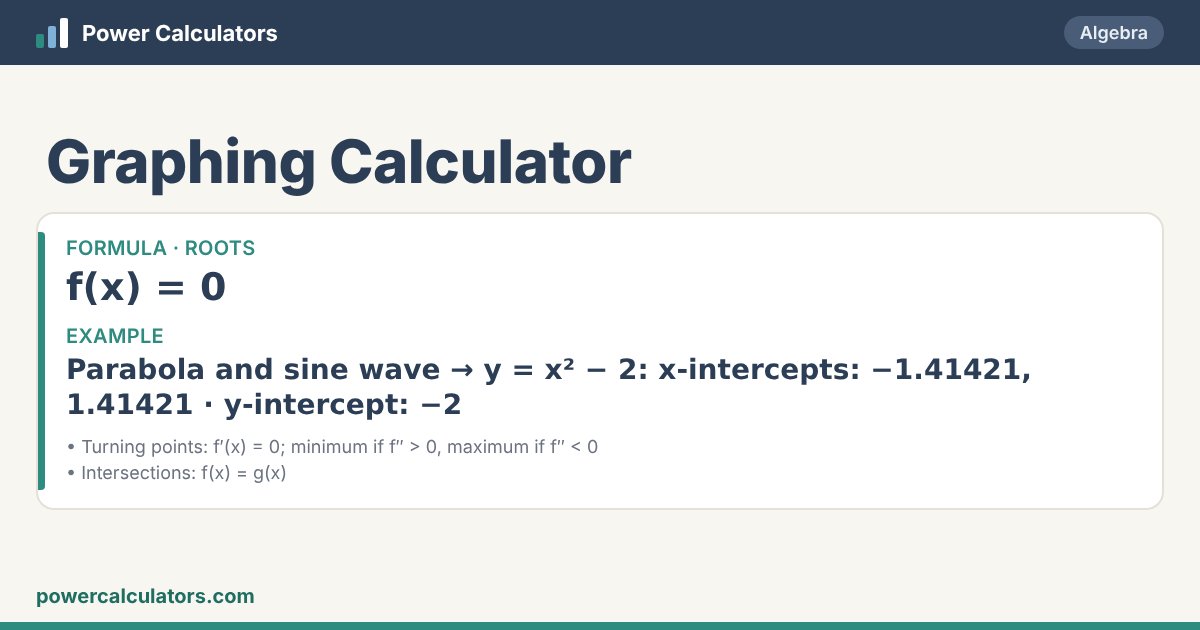
Graphing Calculator: Roots — f(x) = 0. Example: Parabola and sine wave → y = x² − 2: x-intercepts: −1.41421, 1.41421 · y-intercept: −2
How the Graphing Calculator works: Roots — f(x) = 0

Rate this calculator

Was it useful? A quick star rating helps others — and you can leave a comment too.
Rate it: ★ ★ ★ ★ ★

📘 About the Graphing Calculator

A graph shows at a glance how a function behaves — where it is positive, where it crosses the axes, where it peaks and how fast it grows. Plotting two functions together shows where they are equal, which solves the equation f(x) = g(x).

Type up to three functions and the x-range. The calculator plots them and lists the x-intercepts (roots), the y-intercept, local maxima and minima (where the derivative is 0) and the intersection points of each pair, so you can solve equations graphically.

🧮 Formula

Roots
f(x) = 0
Turning points
f′(x) = 0; minimum if f″ > 0, maximum if f″ < 0
Intersections
f(x) = g(x)

✏️ Worked examples

Parabola and sine wave

You enter
y₁ =x^2 - 2
y₂ = (optional)sin(x)
x from-10
x to10
Trig functions useRadians
You get
y = x² − 2x-intercepts: −1.41421, 1.41421 · y-intercept: −2
y = sin(x)x-intercepts: −9.42478, −6.28319, −3.14159, 0, 3.14159, 6.28319, 9.42478 · y-intercept: 0

x-intercepts: −1.41421, 1.41421 · y-intercept: −2.

Cubic with turning points

You enter
y₁ =x^3 - 3x
x from-3
x to3
Trig functions useRadians
You get
y = x³ − 3xx-intercepts: −1.73205, 0, 1.73205 · y-intercept: 0

x-intercepts: −1.73205, 0, 1.73205 · y-intercept: 0.

🧭 How to use this calculator

What you enter

  • y₁ =
  • y₂ = (optional)
  • y₃ = (optional)
  • x from
  • x to
  • Trig functions use

What you get

  • y = x² − 2
  • y = sin(x)

❓ Frequently asked questions

How do I type functions?

Use ^ for powers (x^2), * or juxtaposition for multiplication (2x, 3sin(x)), and functions with brackets: sqrt(x), ln(x), log(x), e^x, abs(x).

How do I find where two graphs intersect?

Enter both functions — the intersection points are listed below the graph.

Why does the graph look cut off near an asymptote?

Very large values (like 1/x near 0) are clipped so the rest of the graph stays readable.