CV Coefficient of Variation Calculator (CV %)

Compare spread across data sets with different units or sizes.

No ratings yet — be the first

Enter details

Separate numbers with commas, spaces or new lines.

Log in or create a free account to save your inputs and results, so you don't have to enter them again next time.🔒 No spam, ever. We never sell or share your details, and you can delete your history or account at any time. Privacy policy

Fill in the details and click Calculate to see your results.

Formula at a glance

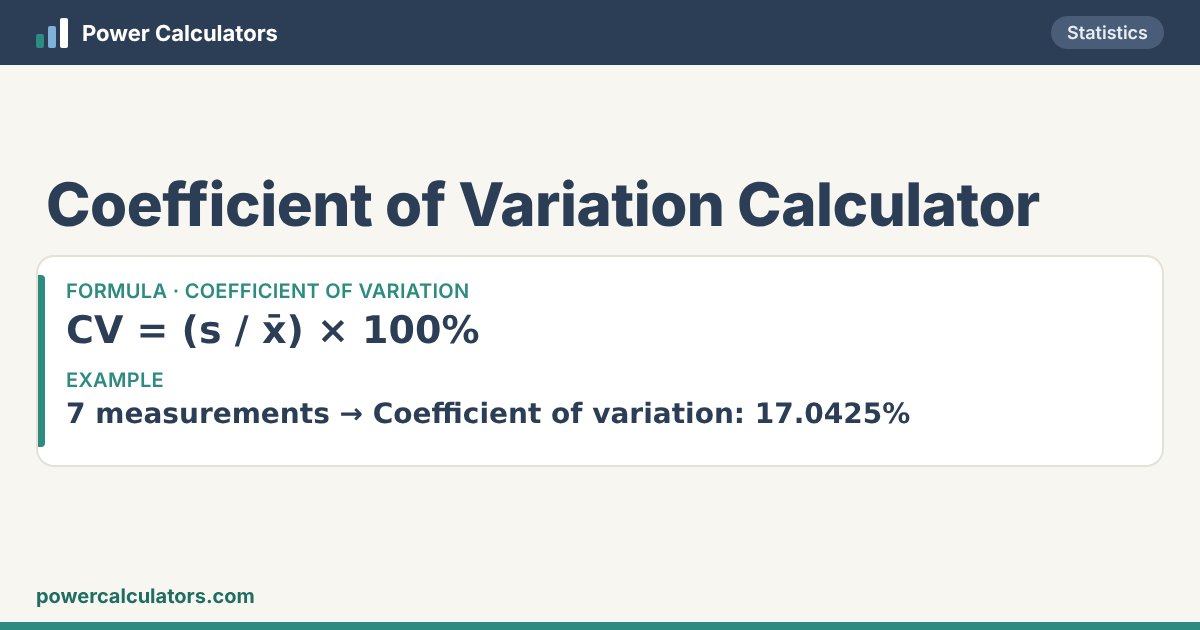
Coefficient of Variation Calculator: Coefficient of variation — CV = (s / x̄) × 100%. Example: 7 measurements → Coefficient of variation: 17.0425%
How the Coefficient of Variation Calculator works: Coefficient of variation — CV = (s / x̄) × 100%

Rate this calculator

Was it useful? A quick star rating helps others — and you can leave a comment too.
Rate it: ★ ★ ★ ★ ★

📘 About the Coefficient of Variation Calculator

The coefficient of variation (CV), also called the relative standard deviation, is the standard deviation as a percentage of the mean. Because it has no units, it compares variability between data sets on different scales — the consistency of two machines, the risk of two investments per unit of return, or the precision of lab assays.

Enter your data and choose sample or population. The calculator gives the CV, the SD and mean behind it and a rough guide to whether variability is low, moderate or high.

🧮 Formula

Coefficient of variation
CV = (s / x̄) × 100%

✏️ Worked examples

7 measurements

You enter
Data12, 15, 11, 18, 14, 16, 13
Data is aSample (divide by n − 1)
You get
Coefficient of variation17.0425%
Standard deviation (sample)2.410295378
Mean14.14285714
As a ratio0.170425
SpreadModerate variability (10–20%)

CV = 17.0425%.

Monthly returns (%)

You enter
Data2.1, 1.8, 2.5, 1.2, 3.0, 2.2
Data is aSample (divide by n − 1)
You get
Coefficient of variation28.6922%
Standard deviation (sample)0.6121002097
Mean2.133333333
As a ratio0.286922
SpreadHigh variability (20–30%)

CV = 28.6922%.

🧭 How to use this calculator

What you enter

  • DataSeparate numbers with commas, spaces or new lines.
  • Data is a

What you get

  • Coefficient of variation
  • Standard deviation (sample)
  • Mean
  • As a ratio
  • Spread

❓ Frequently asked questions

What is a good coefficient of variation?

In lab work a CV under 10–15% is often acceptable; in finance a lower CV means less risk per unit of return. It depends on the field.

Why use CV instead of standard deviation?

SD depends on the scale: an SD of 5 is large for a mean of 10 but tiny for a mean of 1,000. CV puts both on the same footing.

When is CV meaningless?

When the mean is close to 0 or the data can be negative (like temperatures in °C).