σ Standard Deviation Calculator (Sample & Population)

Paste your numbers to get the standard deviation with every step: deviations, squares, sum and square root.

No ratings yet — be the first

Enter details

Separate numbers with commas, spaces or new lines.

Log in or create a free account to save your inputs and results, so you don't have to enter them again next time.🔒 No spam, ever. We never sell or share your details, and you can delete your history or account at any time. Privacy policy

Fill in the details and click Calculate to see your results.

Formula at a glance

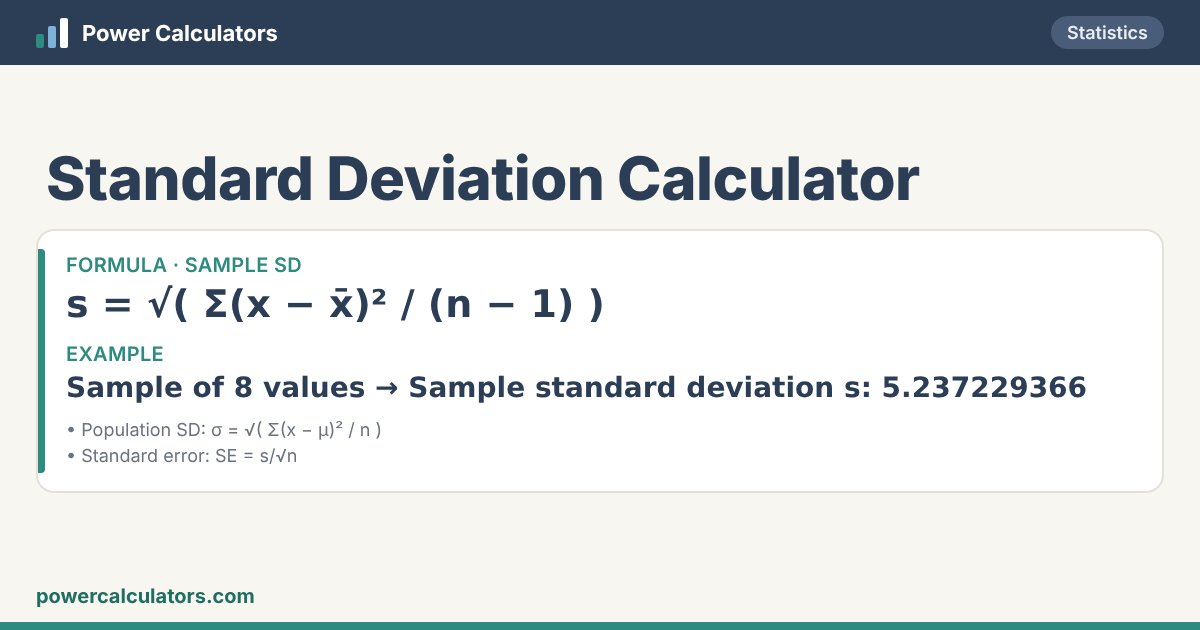
Standard Deviation Calculator: Sample SD — s = √( Σ(x − x̄)² / (n − 1) ). Example: Sample of 8 values → Sample standard deviation s: 5.237229366
How the Standard Deviation Calculator works: Sample SD — s = √( Σ(x − x̄)² / (n − 1) )

Rate this calculator

Was it useful? A quick star rating helps others — and you can leave a comment too.
Rate it: ★ ★ ★ ★ ★

📘 About the Standard Deviation Calculator

Standard deviation measures how spread out numbers are from their mean. A small SD means the values cluster near the average; a large SD means they are widely spread. It is used for exam marks, quality control, investment risk (volatility) and scientific measurements.

Use the sample standard deviation s (dividing by n − 1) when your data are a sample from a larger group — the usual case. Use the population SD σ (dividing by n) when you have every member. The calculator gives both, with the variance, mean, standard error of the mean and a table of deviations.

🧮 Formula

Sample SD
s = √( Σ(x − x̄)² / (n − 1) )
Population SD
σ = √( Σ(x − μ)² / n )
Standard error
SE = s/√n

✏️ Worked examples

Sample of 8 values

You enter
Data10, 12, 23, 23, 16, 23, 21, 16
Data is aSample (divide by n − 1)
You get
Sample standard deviation s5.237229366
Sample variance s²27.42857143
Population SD σ (÷ n)4.898979486 (variance 24)
Mean18
Count n8
Sum144
Sum of squared deviations192
Standard error of the mean1.8516402
Range10 to 23 (13)
Coefficient of variation29.096%
Within 1 SD of the mean6 of 8 values (75%)

s = 5.237229366.

Classic textbook data

You enter
Data2, 4, 4, 4, 5, 5, 7, 9
Data is aPopulation (divide by n)
You get
Population standard deviation σ2
Population variance σ²4
Sample SD s (÷ (n − 1))2.138089935 (variance 4.571428571)
Mean5
Count n8
Sum40
Sum of squared deviations32
Standard error of the mean0.75592895
Range2 to 9 (7)
Coefficient of variation40%
Within 1 SD of the mean6 of 8 values (75%)

σ = 2.

🧭 How to use this calculator

What you enter

  • DataSeparate numbers with commas, spaces or new lines.
  • Data is a

What you get

  • Sample standard deviation s
  • Sample variance s²
  • Population SD σ (÷ n)
  • Mean
  • Count n
  • Sum
  • Sum of squared deviations
  • Standard error of the mean
  • Range
  • Coefficient of variation
  • Within 1 SD of the mean

❓ Frequently asked questions

What is the difference between sample and population standard deviation?

The sample SD divides by n − 1 (Bessel’s correction) to avoid underestimating the spread of the whole population. Use it unless your data include every member.

What is a good standard deviation?

It depends on the mean and context. The coefficient of variation (SD ÷ mean) lets you compare spread between data sets.

How is standard deviation related to variance?

The variance is the square of the standard deviation. The SD is in the same units as the data, which makes it easier to interpret.

What does the 68–95–99.7 rule mean?

For normally distributed data about 68% of values lie within 1 SD of the mean, 95% within 2 SD and 99.7% within 3 SD.