About the Z
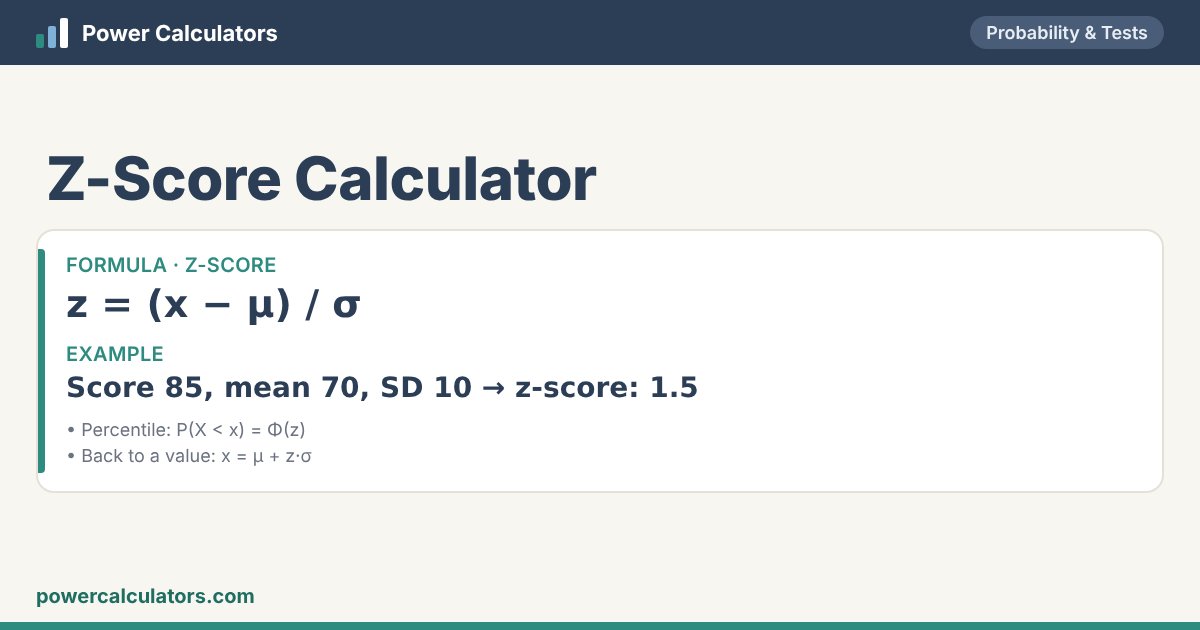
A z-score (standard score) tells you how many standard deviations a value is above or below the mean. It puts different scales on a common footing — comparing an IQ score with an SAT score, or a child’s height with growth charts — and turns values into normal-distribution probabilities and percentiles.
Enter the value, mean and standard deviation (or paste data). The calculator gives z, the percentile (the probability of a lower value), the probability of a higher value, the central area and two-tailed p-value, and shades the area on the bell curve.