📏 Linear Regression Calculator (Line of Best Fit)

Fit the line of best fit through your data and use it to predict.

No ratings yet — be the first

Enter details

Separate numbers with commas, spaces or new lines.

Log in or create a free account to save your inputs and results, so you don't have to enter them again next time.🔒 No spam, ever. We never sell or share your details, and you can delete your history or account at any time. Privacy policy

Fill in the details and click Calculate to see your results.

Formula at a glance

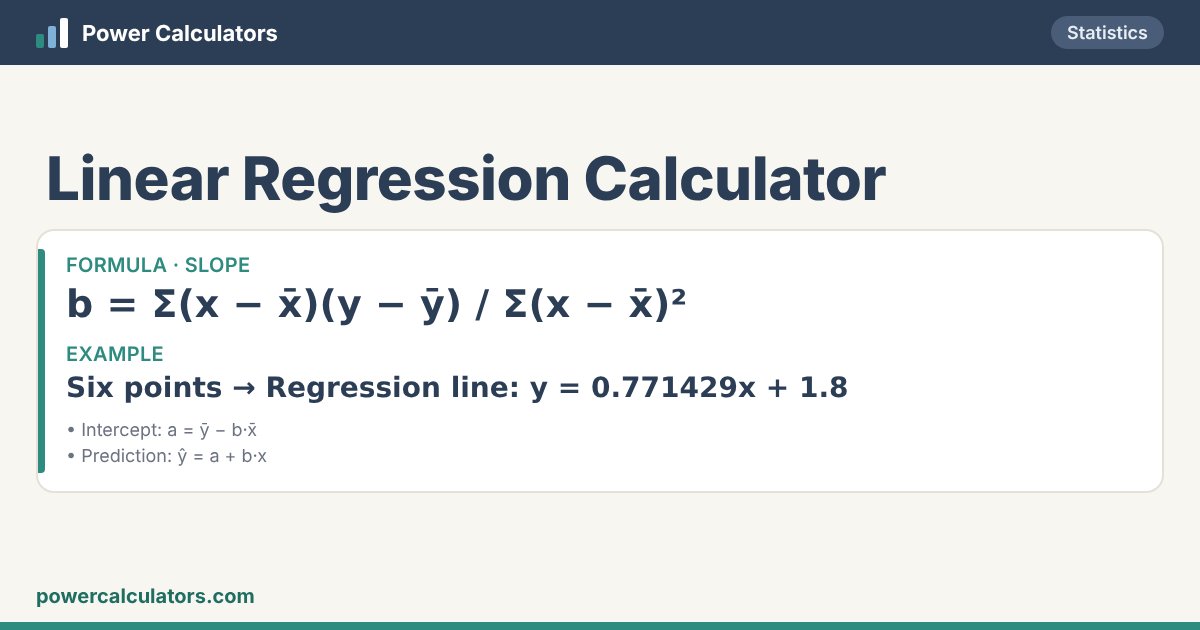
Linear Regression Calculator: Slope — b = Σ(x − x̄)(y − ȳ) / Σ(x − x̄)². Example: Six points → Regression line: y = 0.771429x + 1.8
How the Linear Regression Calculator works: Slope — b = Σ(x − x̄)(y − ȳ) / Σ(x − x̄)²

Rate this calculator

Was it useful? A quick star rating helps others — and you can leave a comment too.
Rate it: ★ ★ ★ ★ ★

📘 About the Linear Regression Calculator

Simple linear regression finds the straight line that best fits paired data, by making the sum of squared vertical distances (residuals) as small as possible. The slope tells you how much Y changes for each unit of X; r² tells you how much of the variation the line explains. It is used for trends, forecasts and calibration curves.

Paste X and Y in matching order. The calculator gives the regression equation, slope, intercept, r and r², the standard error of the estimate, a t-test of the slope, predicted values and residuals, and draws the data with the fitted line.

🧮 Formula

Slope
b = Σ(x − x̄)(y − ȳ) / Σ(x − x̄)²
Intercept
a = ȳ − b·x̄
Prediction
ŷ = a + b·x

✏️ Worked examples

Six points

You enter
X values1, 2, 3, 4, 5, 6
Y values (same order)2, 4, 5, 4, 5, 7
Predict y at x = (optional)7
You get
Regression liney = 0.771429x + 1.8
Slope b0.7714285714
Intercept a1.8
r · r²0.87831 · 0.771429
Standard error of the estimate0.87831
Is the slope significant?t = 3.6742, p = 0.0213116
Predicted y at x = 77.2 (outside the data — extrapolation)

y = 0.771429x + 1.8.

Advertising vs sales

You enter
X values10, 20, 30, 40, 50
Y values (same order)25, 41, 58, 79, 95
Predict y at x = (optional)60
You get
Regression liney = 1.78x + 6.2
Slope b1.78
Intercept a6.2
r · r²0.998929 · 0.997858
Standard error of the estimate1.50555
Is the slope significant?t = 37.387, p = 0.00004209
Predicted y at x = 60113 (outside the data — extrapolation)

y = 1.78x + 6.2.

🧭 How to use this calculator

What you enter

  • X valuesSeparate numbers with commas, spaces or new lines.
  • Y values (same order)
  • Predict y at x = (optional)

What you get

  • Regression line
  • Slope b
  • Intercept a
  • r · r²
  • Standard error of the estimate
  • Is the slope significant?

❓ Frequently asked questions

What is the line of best fit?

The least-squares line: of all straight lines, it has the smallest total of squared vertical distances to the points.

What does r² mean?

The proportion of the variation in Y explained by the line. r² = 0.8 means 80% is explained by X and 20% is scatter.

Can I predict outside my data?

You can, but extrapolation is risky — the relationship may not hold beyond the range you measured.