r Correlation Coefficient Calculator (Pearson r & Spearman ρ)

How strongly two variables move together — and whether it is statistically significant.

No ratings yet — be the first

Enter details

Separate numbers with commas, spaces or new lines.

Log in or create a free account to save your inputs and results, so you don't have to enter them again next time.🔒 No spam, ever. We never sell or share your details, and you can delete your history or account at any time. Privacy policy

Fill in the details and click Calculate to see your results.

Formula at a glance

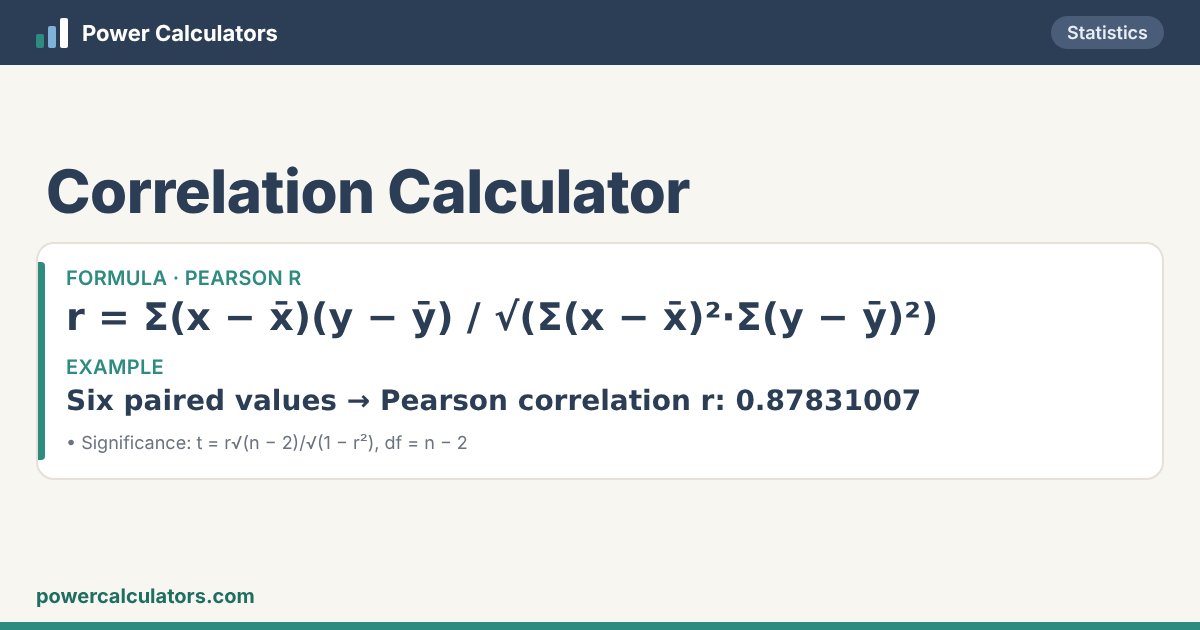
Correlation Calculator: Pearson r — r = Σ(x − x̄)(y − ȳ) / √(Σ(x − x̄)²·Σ(y − ȳ)²). Example: Six paired values → Pearson correlation r: 0.87831007
How the Correlation Calculator works: Pearson r — r = Σ(x − x̄)(y − ȳ) / √(Σ(x − x̄)²·Σ(y − ȳ)²)

Rate this calculator

Was it useful? A quick star rating helps others — and you can leave a comment too.
Rate it: ★ ★ ★ ★ ★

📘 About the Correlation Coefficient Calculator

The correlation coefficient r measures the strength and direction of a straight-line relationship between two variables, from −1 (perfect negative) through 0 (none) to +1 (perfect positive). r² gives the share of the variation in Y explained by X. Spearman’s ρ does the same with ranks, for relationships that rise steadily but not in a straight line.

Paste the X and Y values in matching order. The calculator gives Pearson’s r, r², Spearman’s ρ, the covariance, a plain-English strength rating and a t-test of whether the correlation differs from zero.

🧮 Formula

Pearson r
r = Σ(x − x̄)(y − ȳ) / √(Σ(x − x̄)²·Σ(y − ȳ)²)
Significance
t = r√(n − 2)/√(1 − r²), df = n − 2

✏️ Worked examples

Six paired values

You enter
X values1, 2, 3, 4, 5, 6
Y values (same order)2, 4, 5, 4, 5, 7
You get
Pearson correlation r0.87831007
StrengthStrong positive linear relationship
r² (coefficient of determination)0.771429 — 77.14% of the variation in Y is explained by X
Spearman rank correlation ρ0.85331034
Covariance (sample)2.7
Significance (t-test, df = 4)t = 3.67423, p = 0.0213116 — significant at 5%
Pairs n6

r = 0.87831007.

Study hours vs marks

You enter
X values2, 4, 6, 8, 10
Y values (same order)55, 62, 70, 78, 88
You get
Pearson correlation r0.99792439
StrengthVery strong positive linear relationship
r² (coefficient of determination)0.995853 — 99.59% of the variation in Y is explained by X
Spearman rank correlation ρ1
Covariance (sample)41
Significance (t-test, df = 3)t = 26.8408, p = 0.00011348 — significant at 5%
Pairs n5

r = 0.99792439.

🧭 How to use this calculator

What you enter

  • X valuesSeparate numbers with commas, spaces or new lines.
  • Y values (same order)

What you get

  • Pearson correlation r
  • Strength
  • r² (coefficient of determination)
  • Spearman rank correlation ρ
  • Covariance (sample)
  • Significance (t-test, df = 4)
  • Pairs n

❓ Frequently asked questions

What is a strong correlation?

Roughly |r| ≥ 0.7 is strong, 0.5–0.7 moderate, 0.3–0.5 weak and below 0.3 very weak — but it depends on the field.

Does correlation mean causation?

No. Two variables can move together because of a third factor or by chance. Experiments are needed to show cause.

When should I use Spearman instead of Pearson?

When the data are ranks, have outliers, or the relationship is monotonic but curved.