About the Normal Distribution Calculator
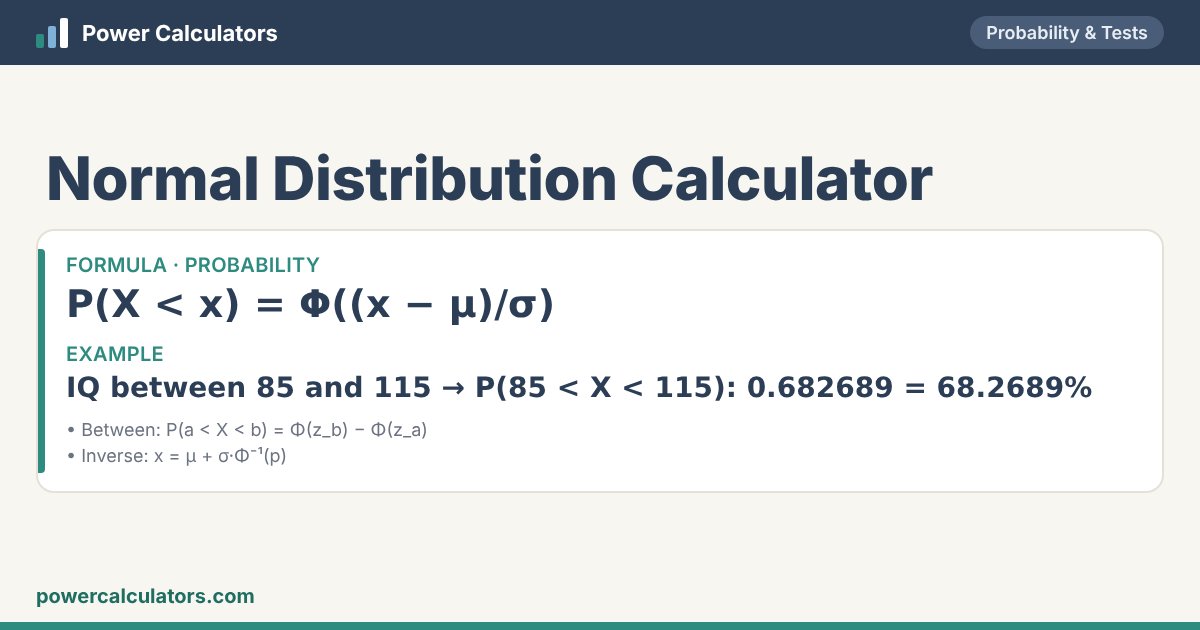
The normal distribution is the bell-shaped curve that describes heights, measurement errors, exam scores, IQ and many natural quantities. It is fixed by its mean (the centre) and standard deviation (the spread). Probabilities are areas under the curve.
Choose the mean and SD, then find the probability below a value, above it, between two values or outside them — or work backwards to the value with a given probability below it (for example the 95th percentile). Results are computed precisely, not read from a z-table.