± Confidence Interval Calculator (Mean & Proportion)

The range that likely contains the true value — with the margin of error.

No ratings yet — be the first

Enter details

Separate numbers with commas, spaces or new lines.

Log in or create a free account to save your inputs and results, so you don't have to enter them again next time.🔒 No spam, ever. We never sell or share your details, and you can delete your history or account at any time. Privacy policy

Fill in the details and click Calculate to see your results.

Formula at a glance

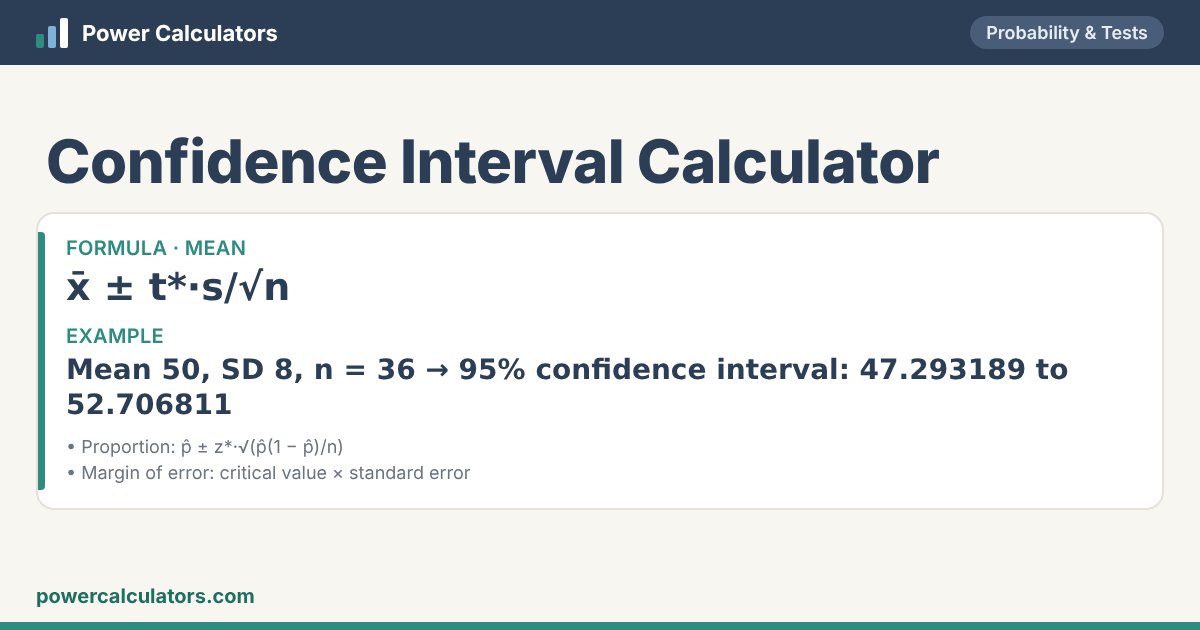
Confidence Interval Calculator: Mean — x̄ ± t*·s/√n. Example: Mean 50, SD 8, n = 36 → 95% confidence interval: 47.293189 to 52.706811
How the Confidence Interval Calculator works: Mean — x̄ ± t*·s/√n

Rate this calculator

Was it useful? A quick star rating helps others — and you can leave a comment too.
Rate it: ★ ★ ★ ★ ★

📘 About the Confidence Interval Calculator

A confidence interval gives a range of plausible values for a population mean or proportion based on a sample. A 95% interval is built by a method that captures the true value 95% of the time. Wider intervals come from smaller samples, more variable data or higher confidence.

For a mean, enter the mean, SD and sample size (or paste data); the t distribution is used unless you know the population SD. For a proportion, enter the number of successes and the sample size; you get the usual Wald interval and the more reliable Wilson interval.

🧮 Formula

Mean
x̄ ± t*·s/√n
Proportion
p̂ ± z*·√(p̂(1 − p̂)/n)
Margin of error
critical value × standard error

✏️ Worked examples

Mean 50, SD 8, n = 36

You enter
Interval for aMean
Confidence level95%
Sample mean50
Standard deviation8
Sample size n36
Population SDUnknown — use t
Successes (proportion)54
You get
95% confidence interval47.293189 to 52.706811
Mean ± margin of error50 ± 2.7068106
Standard error1.3333333
t* (df = 35)2.03011

47.293189 to 52.706811.

54 of 100 said yes

You enter
Interval for aProportion (percentage)
Confidence level95%
Sample mean50
Standard deviation8
Sample size n100
Population SDUnknown — use t
Successes (proportion)54
You get
95% confidence interval44.2316% to 63.7684%
Sample proportion p̂54%
Margin of error± 9.76841%
Wilson interval (better for small n or extreme p)44.2649% to 63.4392%
z*1.95996

44.2316% to 63.7684%.

🧭 How to use this calculator

What you enter

  • Interval for a
  • Confidence level (%)
  • Sample mean
  • Standard deviation
  • Sample size n
  • Or paste data (optional)Separate numbers with commas, spaces or new lines.
  • Population SD
  • Successes (proportion)

What you get

  • 95% confidence interval
  • Mean ± margin of error
  • Standard error
  • t* (df = 35)

❓ Frequently asked questions

What does a 95% confidence interval mean?

If you repeated the study many times, 95% of the intervals made this way would contain the true value. It is not a 95% chance for this one interval.

How can I make the interval narrower?

Increase the sample size (the width shrinks with √n), reduce measurement noise, or accept a lower confidence level.

When do I use t instead of z?

When the population standard deviation is unknown and estimated from the sample — almost always.