⚠️ Outlier Calculator (IQR & Z-Score Methods)

Spot unusual values before you average or chart your data.

No ratings yet — be the first

Enter details

Separate numbers with commas, spaces or new lines.
1.5 is standard; 3 finds only extreme outliers.

Log in or create a free account to save your inputs and results, so you don't have to enter them again next time.🔒 No spam, ever. We never sell or share your details, and you can delete your history or account at any time. Privacy policy

Fill in the details and click Calculate to see your results.

Formula at a glance

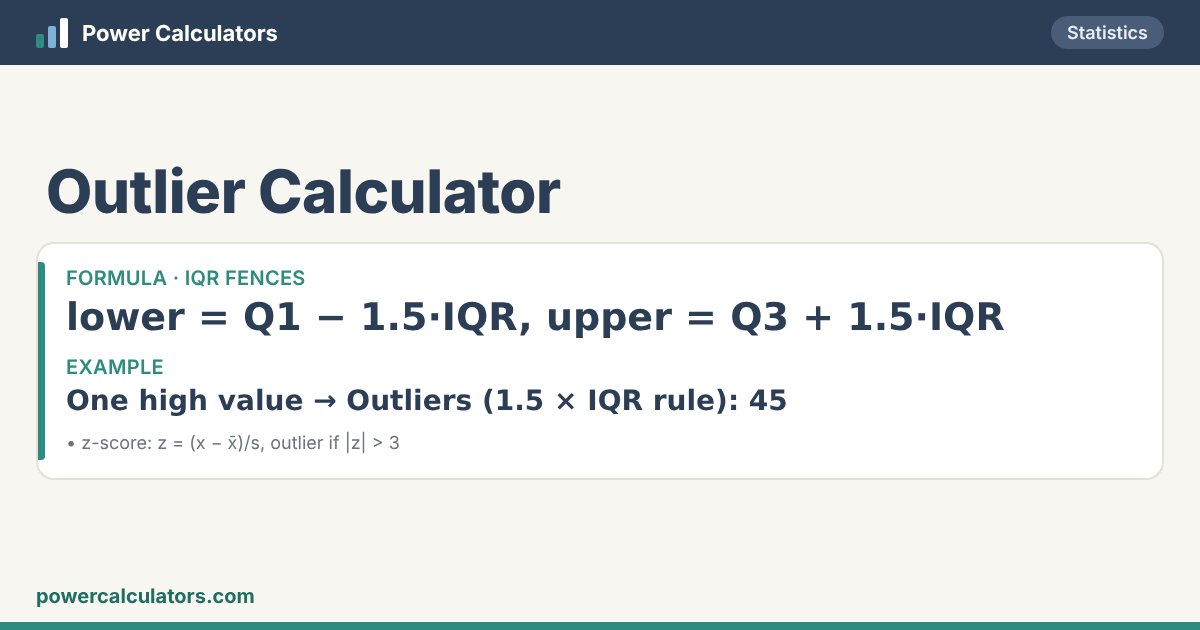
Outlier Calculator: IQR fences — lower = Q1 − 1.5·IQR, upper = Q3 + 1.5·IQR. Example: One high value → Outliers (1.5 × IQR rule): 45
How the Outlier Calculator works: IQR fences — lower = Q1 − 1.5·IQR, upper = Q3 + 1.5·IQR

Rate this calculator

Was it useful? A quick star rating helps others — and you can leave a comment too.
Rate it: ★ ★ ★ ★ ★

📘 About the Outlier Calculator

An outlier is a value far from the rest of the data — a typing error, a measuring fault or a genuinely unusual case. Outliers can drag the mean and inflate the standard deviation, so it pays to find them first.

Tukey’s rule (used for box-plot whiskers) flags values below Q1 − 1.5·IQR or above Q3 + 1.5·IQR, and extreme outliers beyond 3·IQR. The z-score method flags values more than 3 standard deviations from the mean. The calculator lists both, with each value’s z-score.

🧮 Formula

IQR fences
lower = Q1 − 1.5·IQR, upper = Q3 + 1.5·IQR
z-score
z = (x − x̄)/s, outlier if |z| > 3

✏️ Worked examples

One high value

You enter
Data12, 14, 14, 15, 16, 17, 18, 19, 21, 22, 45
Fence multiplier1.5
You get
Outliers (1.5 × IQR rule)45
Fenceslower 3.5 · upper 31.5
Extreme outliers (3 × IQR)45
Q1 · median · Q3 · IQR14 · 17 · 21 · 7
Z-score method (|z| > 3)None
Data without the outliers12, 14, 14, 15, 16, 17, 18, 19, 21, 22

Outliers: 45.

Low and high outliers

You enter
Data2, 31, 33, 34, 35, 35, 36, 38, 40, 75
Fence multiplier1.5
You get
Outliers (1.5 × IQR rule)2, 75
Fenceslower 25.5 · upper 45.5
Extreme outliers (3 × IQR)2, 75
Q1 · median · Q3 · IQR33 · 35 · 38 · 5
Z-score method (|z| > 3)None
Data without the outliers31, 33, 34, 35, 35, 36, 38, 40

Outliers: 2, 75.

🧭 How to use this calculator

What you enter

  • DataSeparate numbers with commas, spaces or new lines.
  • Fence multiplier1.5 is standard; 3 finds only extreme outliers.

What you get

  • Outliers (1.5 × IQR rule)
  • Fences
  • Extreme outliers (3 × IQR)
  • Q1 · median · Q3 · IQR
  • Z-score method (|z| > 3)
  • Data without the outliers

❓ Frequently asked questions

How do you determine an outlier?

Find Q1, Q3 and IQR = Q3 − Q1; anything below Q1 − 1.5·IQR or above Q3 + 1.5·IQR is an outlier.

Should I remove outliers?

Only if they are errors. Genuine outliers can be the most important data; consider reporting results with and without them.

Why might the z-score method miss outliers?

In small samples a big outlier inflates the standard deviation, hiding itself. The IQR method is more robust.