t T-Test Calculator (One-Sample, Two-Sample, Paired)

Is the difference between two means real or just chance?

No ratings yet — be the first

Enter details

Separate numbers with commas, spaces or new lines.

Log in or create a free account to save your inputs and results, so you don't have to enter them again next time.🔒 No spam, ever. We never sell or share your details, and you can delete your history or account at any time. Privacy policy

Fill in the details and click Calculate to see your results.

Formula at a glance

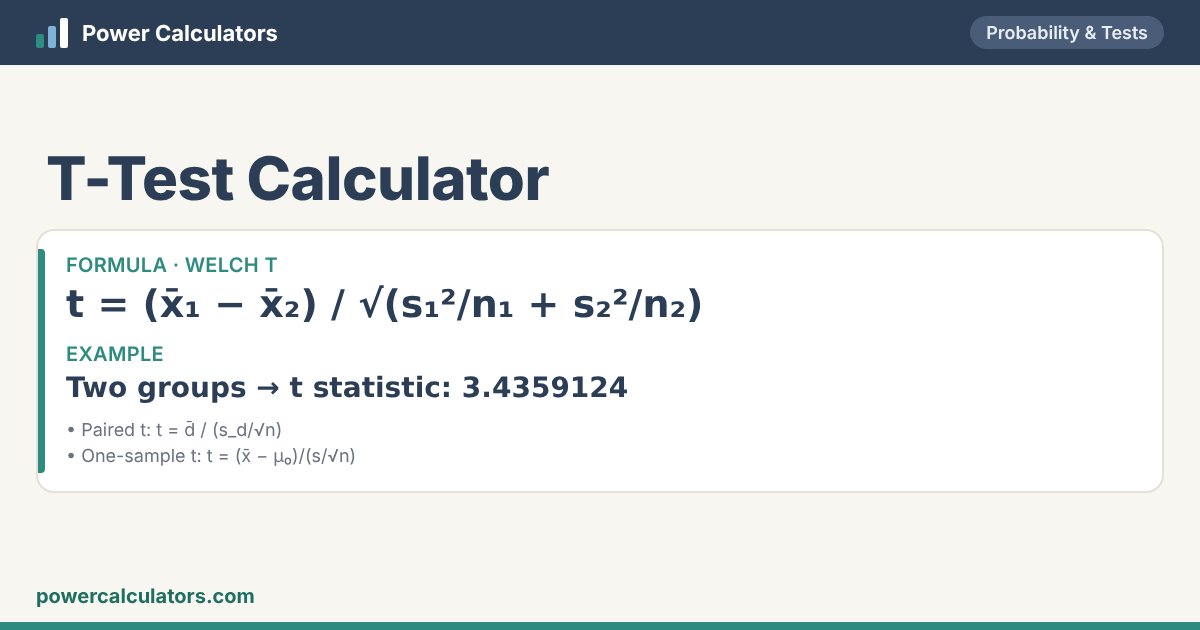
T-Test Calculator: Welch t — t = (x̄₁ − x̄₂) / √(s₁²/n₁ + s₂²/n₂). Example: Two groups → t statistic: 3.4359124
How the T-Test Calculator works: Welch t — t = (x̄₁ − x̄₂) / √(s₁²/n₁ + s₂²/n₂)

Rate this calculator

Was it useful? A quick star rating helps others — and you can leave a comment too.
Rate it: ★ ★ ★ ★ ★

📘 About the T-Test

A t-test checks whether a mean differs from a value, or two means differ from each other, taking the sample size and spread into account. Use the two-sample test for two separate groups (a new teaching method vs the old), the paired test when the same people are measured twice (before and after), and the one-sample test against a known value.

Paste the data, choose the test and the tail. The calculator gives t, the degrees of freedom, the p-value, the decision at your significance level, the confidence interval for the difference and Cohen’s d. Welch’s test is the default for two groups because it does not assume equal variances.

🧮 Formula

Welch t
t = (x̄₁ − x̄₂) / √(s₁²/n₁ + s₂²/n₂)
Paired t
t = d̄ / (s_d/√n)
One-sample t
t = (x̄ − μ₀)/(s/√n)

✏️ Worked examples

Two groups

You enter
TestTwo independent samples (Welch)
Sample 123, 25, 28, 30, 32, 29, 27
Sample 219, 22, 24, 21, 26, 23
Hypothesised mean μ₀ (one-sample)25
TestTwo-tailed (≠)
Significance level α0.05 (95%)
You get
t statistic3.4359124
p-value (two-tailed)0.00558871
Degrees of freedom10.9664
DecisionSignificant at α = 0.05 — reject the null hypothesis (p = 0.00558871 < 0.05)
95% confidence interval for the difference1.87286 to 8.55572
TestWelch’s two-sample t-test (H₀: μ₁ = μ₂)
Effect size (Cohen’s d)1.877

t = 3.4359124, p = 0.00558871.

Before and after (paired)

You enter
TestPaired (before/after)
Sample 1200, 190, 210, 220, 205
Sample 2195, 185, 200, 210, 200
Hypothesised mean μ₀ (one-sample)0
TestTwo-tailed (≠)
Significance level α0.05 (95%)
You get
t statistic5.7154761
p-value (two-tailed)0.00463584
Degrees of freedom4
DecisionSignificant at α = 0.05 — reject the null hypothesis (p = 0.00463584 < 0.05)
95% confidence interval for the difference3.59956 to 10.4004
TestPaired t-test (H₀: mean difference = 0)

t = 5.7154761, p = 0.00463584.

🧭 How to use this calculator

What you enter

  • Test
  • Sample 1Separate numbers with commas, spaces or new lines.
  • Sample 2
  • Hypothesised mean μ₀ (one-sample)
  • Test
  • Significance level α

What you get

  • t statistic
  • p-value (two-tailed)
  • Degrees of freedom
  • Decision
  • 95% confidence interval for the difference
  • Test
  • Effect size (Cohen’s d)

❓ Frequently asked questions

Which t-test should I use?

Two different groups: two-sample (Welch). The same subjects twice: paired. One group against a target: one-sample.

What does the p-value mean?

The probability of a difference at least this large if there were really no difference. Below 0.05 is usually called significant.

What assumptions does the t-test make?

Independent observations and roughly normal data (or samples of about 30 or more per group).