F One-Way ANOVA Calculator

Compare the means of three or more groups in one test.

5.0 out of 5 (1 rating)

Enter details

Separate numbers with commas, spaces or new lines.

Log in or create a free account to save your inputs and results, so you don't have to enter them again next time.🔒 No spam, ever. We never sell or share your details, and you can delete your history or account at any time. Privacy policy

Fill in the details and click Calculate to see your results.

Formula at a glance

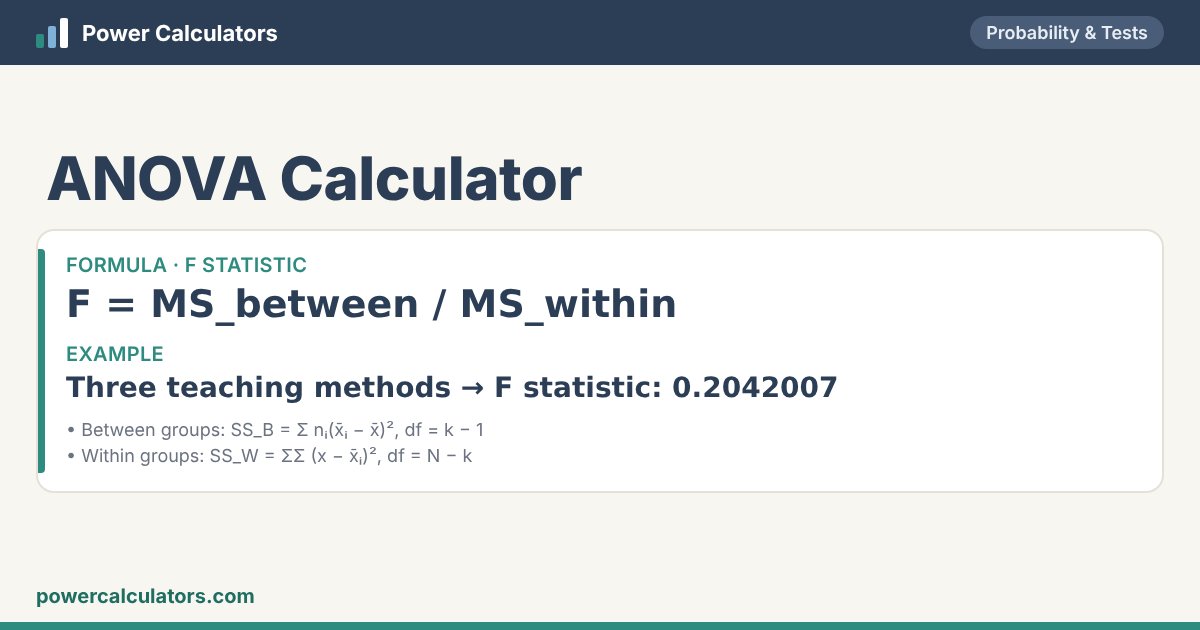
ANOVA Calculator: F statistic — F = MS_between / MS_within. Example: Three teaching methods → F statistic: 0.2042007
How the ANOVA Calculator works: F statistic — F = MS_between / MS_within

Rate this calculator

Was it useful? A quick star rating helps others — and you can leave a comment too.
Rate it: ★ ★ ★ ★ ★

📘 About the One

One-way analysis of variance (ANOVA) tests whether several group means are all equal — for example the scores of students taught by three methods, or the yield of four fertilisers. It compares the variation between the group means with the variation within the groups; a large ratio F means the groups really differ.

Paste each group’s values. The calculator gives the ANOVA table (sums of squares, degrees of freedom, mean squares), F, the p-value, the critical F, the η² effect size and each group’s mean and SD. A significant result says at least one mean differs — a post-hoc test shows which.

🧮 Formula

F statistic
F = MS_between / MS_within
Between groups
SS_B = Σ nᵢ(x̄ᵢ − x̄)², df = k − 1
Within groups
SS_W = ΣΣ (x − x̄ᵢ)², df = N − k

✏️ Worked examples

Three teaching methods

You enter
Group 185, 86, 88, 75, 78, 94, 98
Group 291, 92, 93, 85, 87, 84, 82
Group 379, 78, 88, 94, 92, 85, 83
Significance level α0.05 (95%)
You get
F statistic0.2042007
p-value0.817161
DecisionNot significant at α = 0.05 — do not reject the null hypothesis (p = 0.817161 ≥ 0.05)
Critical F at α = 0.053.55456
Effect size η²0.02219 (2.22% of variation is between groups)
Group 1 mean (n = 7)86.285714 · SD 8.13868
Group 2 mean (n = 7)87.714286 · SD 4.30946
Group 3 mean (n = 7)85.571429 · SD 6.13344

F = 0.2042007, p = 0.817161.

Clearly different groups

You enter
Group 14, 5, 6, 5
Group 28, 9, 7, 8
Group 312, 11, 13, 12
Significance level α0.05 (95%)
You get
F statistic74
p-value0.000002585
DecisionSignificant at α = 0.05 — reject the null hypothesis (p = 0.000002585 < 0.05) — at least one group mean differs
Critical F at α = 0.054.25649
Effect size η²0.9427 (94.3% of variation is between groups)
Group 1 mean (n = 4)5 · SD 0.816497
Group 2 mean (n = 4)8 · SD 0.816497
Group 3 mean (n = 4)12 · SD 0.816497

F = 74, p = 0.000002585.

🧭 How to use this calculator

What you enter

  • Group 1Separate numbers with commas, spaces or new lines.
  • Group 2
  • Group 3
  • Group 4 (optional)
  • Group 5 (optional)
  • Group 6 (optional)
  • Significance level α

What you get

  • F statistic
  • p-value
  • Decision
  • Critical F at α = 0.05
  • Effect size η²
  • Group 1 mean (n = 7)
  • Group 2 mean (n = 7)
  • Group 3 mean (n = 7)

❓ Frequently asked questions

Why not just do several t-tests?

Each extra test adds a chance of a false positive. ANOVA tests all groups at once at your chosen α.

What does the F value mean?

How many times larger the variation between group means is than the variation inside groups. F near 1 suggests no real difference.

What are the assumptions?

Independent observations, roughly normal data in each group and similar variances.

What people are saying
★★★★★
Anonymous · 13 Nov 2026