χ² Chi-Square Test Calculator (Goodness of Fit & Independence)

Do your counts match what you expected — or are two categories related?

No ratings yet — be the first

Enter details

Log in or create a free account to save your inputs and results, so you don't have to enter them again next time.🔒 No spam, ever. We never sell or share your details, and you can delete your history or account at any time. Privacy policy

Fill in the details and click Calculate to see your results.

Formula at a glance

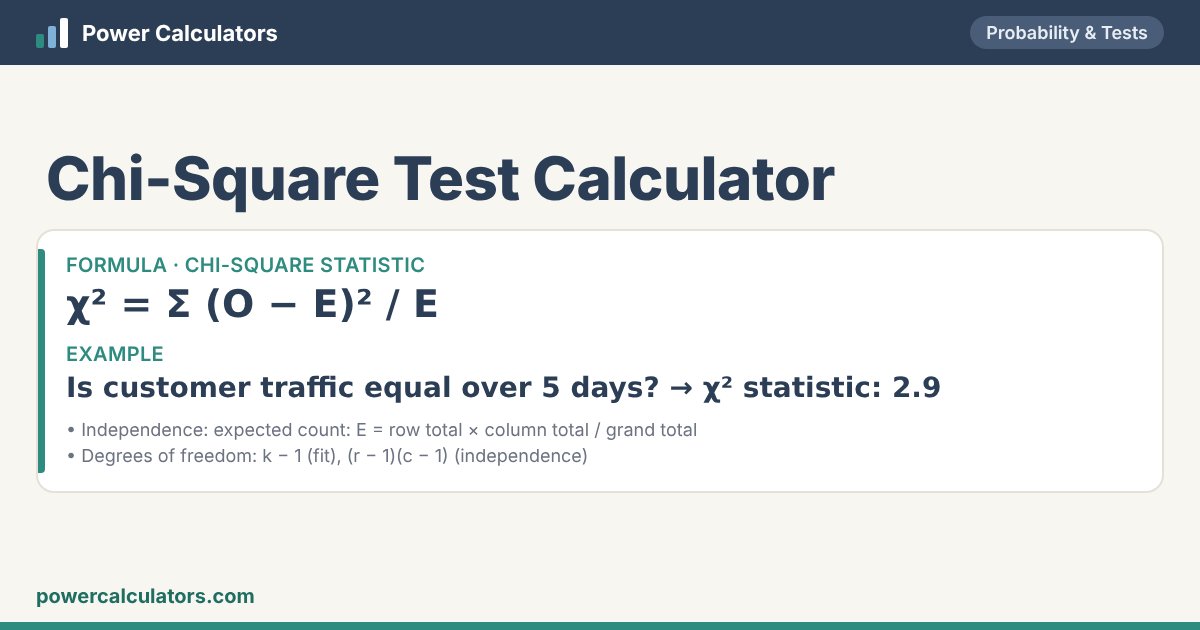
Chi-Square Test Calculator: Chi-square statistic — χ² = Σ (O − E)² / E. Example: Is customer traffic equal over 5 days? → χ² statistic: 2.9
How the Chi-Square Test Calculator works: Chi-square statistic — χ² = Σ (O − E)² / E

Rate this calculator

Was it useful? A quick star rating helps others — and you can leave a comment too.
Rate it: ★ ★ ★ ★ ★

📘 About the Chi-Square Test

The chi-square (χ²) test compares observed counts with the counts you would expect. The goodness-of-fit test asks whether one set of counts follows a given distribution (is a die fair? are sales equal across days?). The test of independence asks whether two categorical variables in a table are related (is preference linked to gender?).

Enter counts — one row for goodness of fit (with expected counts or proportions, or leave them equal), or a table with rows separated by semicolons for independence. The calculator shows each cell’s contribution, χ², degrees of freedom, the p-value, the critical value and a plain decision, and warns if expected counts are below 5.

🧮 Formula

Chi-square statistic
χ² = Σ (O − E)² / E
Independence: expected count
E = row total × column total / grand total
Degrees of freedom
k − 1 (fit), (r − 1)(c − 1) (independence)

✏️ Worked examples

Is customer traffic equal over 5 days?

You enter
TestGoodness of fit (one row of counts)
Observed counts (goodness of fit)18, 22, 20, 25, 15
Significance level α0.05 (95%)
You get
χ² statistic2.9
Degrees of freedom4
p-value0.574697
Critical value at α = 0.059.48773
DecisionNot significant at α = 0.05 — do not reject the null hypothesis (p = 0.574697 ≥ 0.05)
TestChi-square goodness-of-fit test

χ² = 2.9, p = 0.574697.

2 × 2 table

You enter
TestIndependence (contingency table)
Contingency table (independence)20 15; 30 35
Significance level α0.05 (95%)
You get
χ² statistic1.0989011
Degrees of freedom1
p-value0.294507
Critical value at α = 0.053.84146
DecisionNot significant at α = 0.05 — do not reject the null hypothesis (p = 0.294507 ≥ 0.05)
TestChi-square test of independence
Effect size (Cramér’s V)0.1048

χ² = 1.0989011, p = 0.294507.

🧭 How to use this calculator

What you enter

  • Test
  • Observed counts (goodness of fit)
  • Expected counts or proportions (optional)
  • Contingency table (independence)
  • Significance level α

What you get

  • χ² statistic
  • Degrees of freedom
  • p-value
  • Critical value at α = 0.05
  • Decision
  • Test

❓ Frequently asked questions

What does a significant chi-square mean?

The observed counts differ from the expected ones by more than chance would usually allow — the distribution does not fit, or the variables are related.

What is the minimum expected count?

A common rule is at least 5 in each cell; otherwise combine categories or use Fisher’s exact test.

Can I use percentages?

Use the raw counts. Expected values may be given as proportions — they are scaled to the total.